PhotoZ
- class eazy.photoz.PhotoZ(param_file=None, translate_file=None, zeropoint_file=None, load_prior=True, load_products=False, params={}, n_proc=0, cosmology=None, compute_tef_lnp=True, tempfilt=None, tempfilt_data=None, random_seed=0, random_draws=100, **kwargs)[source]
Bases:
objectMain object for fitting templates / photometric redshifts
- Parameters:
- param_filestr
Parameter filename. If nothing specified, then reads the default parameters from file
eazy/data/zphot.param.default.- translate_filestr
Translation filename for
eazy.param.TranslateFile.- zeropoint_filestr
File with catalog zeropoint corrections with
read_zeropoint- load_priorbool
Compute the apparent-magnitude prior
- load_productsbool
Load previously-generated
eazyproducts ifzoutanddatafiles are found (load_products)- paramsdict
Run-time parameters that supersede parameters read from
param_file. The parameters are set in the following order:Read from
param_fileAdd any missing parameters from file
eazy/data/zphot.param.defaultOverride from
params
- n_procint
Number of processes to use for
multiprocessing-enabled functions. If < 0, then get frommultiprocessing.cpu_count.- cosmology
astropy.cosmologyobject If not specified, generate a flat cosmology with
params['H0', 'OMEGA_M', 'OMEGA_L'].- compute_tef_lnpbool
Precompute likelihood normalization correction for the
TemplateErrorfunction.- tempfilt
TemplateGridor None Precomputed template grid.
- random_seedint
Random number seed for e.g., random draws from parameter covariances
- random_drawsint
Number of random draws from fit coefficients used for analytic uncertainties.
Note
This can create a very large
coeffs_drawsarray with dimensions(NOBJ, random_draws, NTEMP).
- Attributes:
NOBJNumber of objects in catalog
NZNumber of redshift grid points
NFILTNumber of filters
NTEMPNumber of templates
pivotFilter
pivotwavelengths, Angstromsto_flamConversion factor to \(10^{-19} erg/s/cm^2/Å\)
to_uJyConversion of observed fluxes to
microJansky- param
EazyParam Parameters
- translate
TranslateFile Parsed
translate_file- cat
Table The raw catalog read from
params['CATALOG_FILE']OBJIDidcolumn data from the (translated) catalog with sizeNOBJZSPECz_speccolumn data from the (translated) catalog (or -1.)RAraRight Ascension column data from the (translated) catalogDECdecDeclination column data from the (translated) catalog- templateslist
List of
Templateobjects fromparams['TEMPLATES_FILE']- filterslist
List of
FilterDefinitionobjects- f_numbersarray (NFILT)
Filter numbers of catalog filters in
params['FILTER_FILE']- flux_columnsarray (NFILT)
Catalog column names of the photometric flux densities
- err_columnsarray (NFILT)
Catalog column names of the photometric uncertainties
- fnuarray (NOBJ, NFILT)
Catalog flux densities
- efnu_origarray (NOBJ, NFILT)
Uncertainties as read from the catalog
- efnuarray (NOBJ, NFILT)
Uncertainties that could have been modified by, e.g.,
set_sys_err. This is the array used in the template fit.- ok_databool array (NOBJ, NFILT)
Filters and uncertainties that satisfy the
params['NOT_OBS_THRESHOLD']criteria.- lc_reddestarray (NOBJ)
Reddest (valid) filter pivot wavelength available for each object
- zparray (NFILT)
Multiplicative “zeropoint correction” scaled factors, applied to
fnu,efnubefore fitting with the template photometry.- ext_reddenarray (NFILT)
Values needed to remove MW redenning if it has been included in the input catalog (
params['CAT_HAS_EXTCORR']= True)- ext_corrarray (NFILT)
MW extinction correction (<= 1)
- tempfilt
TemplateGrid Grid of
templatesintegrated throughfilters- RES
FilterFile The full filter file object
- TEF
TemplateError Template error function object
- chi2_fitarray (NOBJ, NZ)
chi-squared of the template fit at each redshift grid point
- fit_coeffsarray (NOBJ, NZ, NTEMP)
Fit coefficients for all objects and redshifts
- full_logpriorarray (NOBJ, NZ)
Apparent magnitude prior from
set_prior- lnp_betaarray (NOBJ, NZ)
Beta prior from
prior_beta- lnparray (NOBJ, NZ)
Full log-likelihood grid from
compute_lnp- lnpmaxarray (NOBJ)
maximum of lnp(z)
- zmlarray (NOBJ)
Maximum-likelihood redshift
evaluate_zml- ZML_WITH_PRIORbool
zmlwas computed with the apparent mag prior- ZML_WITH_BETA_PRIORbool
zmlwas computed with the beta prior- zbestarray (NOBJ)
Array where fit coefficients are saved. Generally
zml, but can be set to something else for, e.g.,standard_output.- ZPHOT_AT_ZSPECbool
zbestcomputed fixing the reshift tocat['z_spec']when available- ZPHOT_USERbool
zbestwas supplied by the user- chi2_bestarray (NOBJ)
chi-squared evaluated at z =
zbest- coeffs_bestarray (NOBJ)
Template coefficients evaluted at z =
zbest- fmodelarray (NOBJ, NFILT)
Flux-densities of best-fit template in same units as
fnu- efmodelarray (NOBJ, NFILT)
Uncertainties on
fmodelfrom covariance matrix- coeffs_drawsarray (NOBJ,
random_draws, NTEMP) Random draws from the template fit covariance matrix
Attributes Summary
Array data type from
ARRAY_NBITSparameterdecDeclination column data from the (translated) catalog (or -1.) with sizeNOBJGalactic extinction E(B-V)
Number of random draws, taken from
coeffs_drawsattributeNumber of filters
Number of objects in catalog
Number of templates
Number of redshift grid points
idcolumn data from the (translated) catalog with sizeNOBJraRight Ascension column data from the (translated) catalog (or -1.) with sizeNOBJz_speccolumn data from the (translated) catalog (or -1.) with sizeNOBJindex of nearest
zgridvalue tozbest.zgridindex wherechi2_fitmaximizedzgridindex wherelnpmaximizedFilter pivot wavelengths (deprecated, use
pivot)Filter
pivotwavelengths, AngstromsConversion factor to \(10^{-19} erg/s/cm^2/Å\)
Conversion of observed fluxes to
microJanskyRedshift at
izchi2index.Methods Summary
PIT(zspec)PIT function for evaluating the calibration of p(z), as described in Tanaka (2017).
abs_mag([f_numbers, cosmology, rest_kwargs])Get absolute mags (e.g., M_UV tophat filters).
apply_spatial_offset(f_ix, bin2d[, xycols])Apply a spatial zeropoint offset determined from spatial_statistics.
cdf_percentiles([cdf_sigmas])Redshifts of PDF percentiles in terms of σ for a normal distribution, useful for compressing the PDF.
"Risk" function from Tanaka et al. 2017.
Full "risk" profile from Tanaka et al. 2017.
compute_lnp([prior, beta_prior, ...])Compute log-likelihood from chi2, prior, and TEF terms
compute_tef_lnp([in_place])Uncertainty + TEF component of the log likelihood
error_residuals([level, verbose])Force error bars to touch the best-fit model
evaluate_zml([prior, beta_prior, ...])Evaluate the maximum likelihood redshift with optional priors
find_peaks([thres, min_dist_dz])Find discrete peaks in
lnpwith peakutils module.fit_at_zbest([zbest, prior, beta_prior, ...])Recompute the fit coefficients at the "best" redshift.
fit_catalog([idx, n_proc, verbose, ...])This is the main function for fitting redshifts for a full catalog and is parallelized by fitting each redshift grid step separately.
fit_parallel(*args, **kwargs)Back-compatibility, the new function is
fit_catalogfit_phoenix_stars([filter_mask, wave_lim, ...])Fit grid of Phoenix stars
fit_single_templates([templates, tempfilt, ...])Fit individual templates on the redshift grid
get_grizli_photometry([id, rd, grizli_templates])Get photometry dictionary of a given object that can be used with
grizlifits.get_match_index([id, rd, verbose])Get object index of closest match based either on
id(exact) or closest to specified(ra, dec) = rd.get_maxlnp_redshift([prior, beta_prior, ...])Fit parabola to
lnpto get continuous max(lnp) redshift.iterate_zp_templates([idx, ...])Iterative detemination of zeropoint corrections
lcz([zbest])Redshifted filter wavelengths using
zbest.load_products([compute_error_residuals, fitter])Load results from
zoutanddataFITS files created bystandard_output.make_csv_catalog([include_zeropoints, ...])Make a standardized catalog table in CSV format
observed_frame_fluxes([f_numbers, filters, ...])Observed-frame fluxes in additional (e.g., unobserved) filters
prior_beta([w1, w2, dw, sample, width_params])Prior on UV slope β to disfavor red low-z galaxies put at z>4 with unphysically-red colors.
pz_percentiles([percentiles, oversample, ...])Compute percentiles of the final PDF(z)
read_catalog([verbose])Read catalog specified in
params['CATALOG_FILE'].read_prior([zgrid, prior_file, prior_floor])Read an eazy apparent magnitude prior file
read_zeropoint([zeropoint_file])Read zphot.zeropoint file with multiplicative flux corrections
residuals([selection, minsn, ...])Show residuals and compute zeropoint offsets
rest_frame_SED([idx, norm_band, c, min_sn, ...])Make Rest-frame SED plot
rest_frame_fluxes([f_numbers, pad_width, ...])Rest-frame fluxes, refit by down-weighting bands far away from the desired RF band.
save_templates([prefix, ext, format, ...])Write scaled versions of the templates to files, including a templates definition file
Determine valid catalog data:
set_prior([verbose])Read
param['PRIOR_FILE']set_sys_err([positive, in_place])Include systematic error in uncertainties from
param['SYS_ERR'].set_template_error([TEF, compute_tef_lnp])Set the Template Error Function
Set
zgridandtrdzattributes fromZ_MIN,Z_MAX,Z_STEP, andZ_STEP_TYPEparametersshow_fit(id[, id_is_idx, zshow, show_fnu, ...])Make plot of SED and p(z) of a single object
show_fit_plotly(id_i[, show_fnu, ...])Plot SED + p(z) using
plotlyinterfacespatial_statistics([band_indices, xycols, ...])Show statistics as a function of position
sps_parameters([UBVJ, extra_rf_filters, ...])Rest-frame colors and population parameters at redshift in
self.zbestattributestandard_output([zbest, prior, beta_prior, ...])Full output to
zout.fitsfile.to_prospector([id, rd])Get the photometry and filters in a format that Prospector can use
write_zeropoint_file([file])zphot_zspec([selection, min_zphot, zmin, ...])Make zphot - zspec comparison plot
Attributes Documentation
- ARRAY_DTYPE
Array data type from
ARRAY_NBITSparameter
- MW_EBV
Galactic extinction E(B-V)
- NDRAWS
Number of random draws, taken from
coeffs_drawsattribute
- NFILT
Number of filters
- NOBJ
Number of objects in catalog
- NTEMP
Number of templates
- NZ
Number of redshift grid points
- ZML_WITH_BETA_PRIOR = None
- ZML_WITH_PRIOR = None
- ZPHOT_AT_ZSPEC = None
- ZPHOT_USER = None
- izbest
index of nearest
zgridvalue tozbest.
- izchi2
zgridindex wherechi2_fitmaximized
- izml
zgridindex wherelnpmaximized
- to_flam
Conversion factor to \(10^{-19} erg/s/cm^2/Å\)
- to_uJy
Conversion of observed fluxes to
microJansky
Methods Documentation
- PIT(zspec)[source]
PIT function for evaluating the calibration of p(z), as described in Tanaka (2017).
- abs_mag(f_numbers=[271, 272, 274], cosmology=None, rest_kwargs={'max_err': 0.5, 'pad_width': 0.5, 'percentiles': [2.5, 16, 50, 84, 97.5], 'simple': False, 'verbose': False})[source]
Get absolute mags (e.g., M_UV tophat filters).
- Parameters:
- f_numberslist
List of either unit-indices of filters in
self.RESread from FILTER_FILE orFilterDefinitionobjects.- cosmology
astropy.cosmologyobject If
None, default toself.cosmology.- rest_kwargsdict
Arguments passed to
rest_frame_fluxes
- Returns:
- tab
astropy.table.Table Table with rest-frame luminosities.
tab.metaincludes the filter information.
- tab
- apply_spatial_offset(f_ix, bin2d, xycols=None)[source]
Apply a spatial zeropoint offset determined from spatial_statistics.
- cdf_percentiles(cdf_sigmas=array([-5., -4.8, -4.6, -4.4, -4.2, -4., -3.8, -3.6, -3.4, -3.2, -3., -2.8, -2.6, -2.4, -2.2, -2., -1.8, -1.6, -1.4, -1.2, -1., -0.8, -0.6, -0.4, -0.2, 0., 0.2, 0.4, 0.6, 0.8, 1., 1.2, 1.4, 1.6, 1.8, 2., 2.2, 2.4, 2.6, 2.8, 3., 3.2, 3.4, 3.6, 3.8, 4., 4.2, 4.4, 4.6, 4.8, 5.]), **kwargs)[source]
Redshifts of PDF percentiles in terms of σ for a normal distribution, useful for compressing the PDF.
- compute_lnp(prior=False, beta_prior=False, clip_wavelength=1100, in_place=True)[source]
Compute log-likelihood from chi2, prior, and TEF terms
- Parameters:
- priorbool
Apply apparent magnitude prior
- beta_priorbool
Apply UV-slope beta prior
- clip_wavelengthfloat or None
If specified, set pz = 0 at redshifts beyond where
clip_wavelength*(1+z)is greater than the reddest valid filter for a given object.
- Returns:
- Updates
lnp,lnpmaxattributes.
- Updates
- evaluate_zml(prior=False, beta_prior=False, clip_wavelength=1100)[source]
Evaluate the maximum likelihood redshift with optional priors
- Parameters:
- priorbool
Apply apparent magnitude prior
- beta_priorbool
Apply UV slope beta prior
- clip_wavelengthfloat
Parameter for
compute_lnp
- Returns:
- Sets
zmlattribute
- Sets
- find_peaks(thres=0.8, min_dist_dz=0.1)[source]
Find discrete peaks in
lnpwith peakutils module.- Parameters:
- thres: float
Threshold passed to
peakutils.indexes.- min_dist_dz: float
Peak separation in units of dz*(1+z)
- fit_at_zbest(zbest=None, prior=False, beta_prior=False, get_err=False, clip_wavelength=1100, selection=None, n_proc=0, par_skip=10000, recompute_zml=True, **kwargs)[source]
Recompute the fit coefficients at the “best” redshift.
If
zbestnot specified, then will fit at the maximum likelihood redshift from thezmlattribute.
- fit_catalog(idx=None, n_proc=4, verbose=True, get_best_fit=True, prior=False, beta_prior=False, **kwargs)[source]
This is the main function for fitting redshifts for a full catalog and is parallelized by fitting each redshift grid step separately.
- Parameters:
- idxarray-like or None
Bool or index array for of a subset of objects if you don’t want to fit the full catalog.
- n_procint
The catalog fit is parallelized by precomputing the
TemplateGridphotometry andTemplateErrorfunction at each redshift in the and deriving the fit coefficients and chi2 for all objects at that redshift. Number of parallel processes to use. If 0, then run in serial mode.- verbosebool
Some control of status messages
- get_best_fitbool
Get template coefficients at maximum-likelihood redshift after fitting.
- priorbool
Apply apparent magnitude prior
- beta_priorbool
Apply UV slope beta priorr
- Returns:
- Updates various attributes, like
chi2_fit,fit_coeffs.
- Updates various attributes, like
- fit_parallel(*args, **kwargs)[source]
Back-compatibility, the new function is
fit_catalog
- fit_phoenix_stars(filter_mask=None, wave_lim=[3000, 40000.0], apply_extcorr=False, sys_err=None, stars=None, sonora=True, just_dwarfs=False, lowz_kwargs={}, subset=None)[source]
Fit grid of Phoenix stars
- Parameters:
- filter_maskbool array
Optional mask array for a subset of the available filters to include
- wave_lim(float, float)
Only include filters with pivot wavelengths in this range available for the stellar templates
- apply_extcorrbool
Apply the MW extinction correction before fitting the templates. This is False by default because likely stars are within the MW and therefore not subject to the full extinction used for extragalactic sources
- sys_errfloat
Explicit systematic uncertainty to use, other than
params['SYS_ERR']- starslist
List of templates to fit
- sonorabool
Use Sonora templates from
eazy.templates.load_sonora_stars- just_dwarfsbool
Use the dwarf star template grids from Sonora and LOWZ
- lowz_kwargsdict
Keyword arguments passed to
eazy.templates.load_LOWZ_templates- subsetarray-like, None
Either a bool or index array of an optional subset of sources to fit. If None, then set object attributes along with the returned dictionary
- Returns:
- Sets/updates
NSTAR,star_templates,star_teff,star_logg, star_zmet,star_fluxattributes independent ofsubset.- resultdict
Result dictionary where
NOBJis the full catalog or the number of sources in thesubset.star_tnorm: (NOBJ, NSTAR) template normalizationsstar_chi2: (NOBJ, NSTAR) chi-squared of the star template fitsstar_min_ix: (NOBJ) Index of the template list at star_min_chi2star_min_chi2: (NOBJ) Minimum chi-squared of the template fitsstar_min_chinu: (NOBJ)star_min_chi2 / (nusefilt - 1)star_gal_chi2: (NOBJ) chi-squared of the best-fitting galaxy modelwith the same uncertainty weights as the stellar template fit
- Sets/updates
- fit_single_templates(templates=None, tempfilt=None, include_igm=True, norm_deg=2, verbose=True)[source]
Fit individual templates on the redshift grid
- Parameters:
- templateslist, None
List of
Templateobjects- include_igmbool
Include IGM absorption if
templatesprovided- norm_degint
If > 0, normalization of the template grid with
numpy.linalg.norm(ord=norm).- tempfiltarray (NZ, NTEMP, NFILT)
Template(s) integrated through bandpasses. If not provided, use the internal templates generated upon initialization.
- Returns:
- tempfiltarray (NZ, NTEMP, NFILT)
Integrated template grid
- amplarray (NTEMP, NOBJ, NZ)
Fit amplitudes
- chi2array (NTEMP, NOBJ, NZ)
Chi-squared of the fit
- logpzarray(NTEMP, NOBJ, NZ)
Log probability
- get_grizli_photometry(id=1, rd=None, grizli_templates=None)[source]
Get photometry dictionary of a given object that can be used with
grizlifits.
- get_match_index(id=None, rd=None, verbose=True)[source]
Get object index of closest match based either on
id(exact) or closest to specified(ra, dec) = rd.
- get_maxlnp_redshift(prior=False, beta_prior=False, clip_wavelength=1100)[source]
Fit parabola to
lnpto get continuous max(lnp) redshift.- Parameters:
- priorbool
- beta_priorbool
- clip_wavelengthfloat
Parameters passed to
compute_lnp
- Returns:
- zmlarray (NOBJ)
Redshift where lnp is maximized
- maxlnparray (NOBJ)
Maximum of lnp
- iterate_zp_templates(idx=None, update_templates=True, update_zeropoints=True, iter=0, n_proc=4, save_templates=False, error_residuals=False, prior=True, get_spatial_offset=False, spatial_offset_keys={'apply': True}, **kwargs)[source]
Iterative detemination of zeropoint corrections
- load_products(compute_error_residuals=False, fitter='nnls', **kwargs)[source]
Load results from
zoutanddataFITS files created bystandard_output.- Parameters:
- compute_error_residualsbool
Run
error_residualsafter reading data- fitterstr
Least-squares method for template fits. See
template_lsq.
- Returns:
- Sets various internal attributes
- make_csv_catalog(include_zeropoints=True, scale_to_ujy=True)[source]
Make a standardized catalog table in CSV format
- Parameters:
- include_zeropointsbool
Include zeropoint factors in flux+err columns
- scale_to_ujybool
Scale photometry to microJansky units using the
PRIOR_ABZPparameter
- Returns:
- tab, trans
Table tabis the photometric table.transis the column translations that can be put into aeazy.param.TranslateFile.
- tab, trans
- observed_frame_fluxes(f_numbers=[325], filters=None, verbose=True, n_proc=-1, percentiles=[2.5, 16, 50, 84, 97.5])[source]
Observed-frame fluxes in additional (e.g., unobserved) filters
- Parameters:
- f_numbers: list
Unit-index of filters specified in
params['FILTER_FILE'].- filters: list, optional
Manually-specified
FilterDefinitionobjects. If specified, then supercedesf_numbers.- n_proc: int
Number of processors passed to
TemplateGrid.- percentiles: list or None
If specified, compute percentiles of the template fluxes based on the random template coefficient draws in
coeffs_drawsattribute.
- Returns:
- tab:
astropy.table.Table Table of the observed-frame flux densities with metadata describing the filters.
- tab:
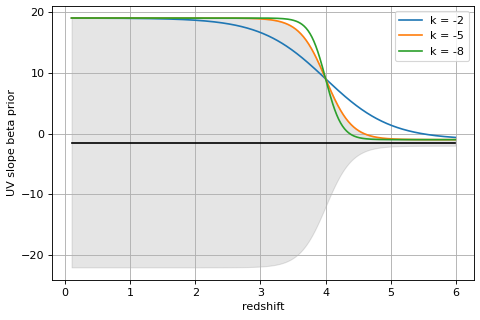
- prior_beta(w1=1350, w2=1800, dw=100, sample=None, width_params={'center': -1.5, 'k': -5, 'sigma0': 20, 'sigma1': 0.5, 'z_split': 4})[source]
Prior on UV slope β to disfavor red low-z galaxies put at z>4 with unphysically-red colors.
Beta is defined here as the logarithmic slope between two filters with width
dwevaluated at wavelengthsw1andw2, set closer to the Lyman break than the usual definition to handle cases at z > 10 where the slope might be constrained by only a single filter.To evaluate the prior, the likelihood of the observed β(z) is computed from a normal distribution with redshift-dependent width set by a logistic function that has width
sigma0at z <z_splitandsigma1otherwise.centerspecifies the middle of the beta distribution.The prior function is the cumulative probability P(>β) for each object at each redshift grid point.
import numpy as np
import matplotlib.pyplot as plt

k = -5
z_split = 4
sigma0 = 20
sigma1 = 0.5
center = -1.5

zgrid = np.arange(0.1, 6, 0.010)

sigma_beta_z = 1./(1+np.exp(-k*(zgrid - z_split)))*sigma0
sigma_beta_z += sigma1

fig, ax = plt.subplots(1,1,figsize=(6,4))

ax.plot(zgrid, zgrid*0+center, color='k')
ax.fill_between(zgrid, center-sigma_beta_z,
                 center+sigma_beta_z, color='k', alpha=0.1)

for k in [-2, -5, -8]:
    sigma_beta_z = 1./(1+np.exp(-k*(zgrid - z_split)))*sigma0
    sigma_beta_z += sigma1

    ax.plot(zgrid, center+sigma_beta_z, label=f'k = {k}')

ax.legend()
ax.grid()
ax.set_xlabel('redshift')
ax.set_ylabel('UV slope beta prior')
fig.tight_layout(pad=0.5)
(
Source code,png,hires.png,pdf)
- Parameters:
- w1, w2float
Rest wavelength of blue and red “filters” for computing UV slope
- dwfloat
Width of tophat filters
- samplearray
Boolean or index array for computing only a subset of objects in the catalog
- width_paramsdict
Parameters of the prior
- Returns:
- p_betaarray (NOBJ, NZ)
Linear prior probability
- pz_percentiles(percentiles=[2.5, 16, 50, 84, 97.5], oversample=5, selection=None)[source]
Compute percentiles of the final PDF(z)
- Parameters:
- percentileslist
Percentiles to compute from the p(z) distribution
- oversampleint
Oversampling factor of the redshift grid for smoother interpolation
- selectionarray-like
Subsample selection array (bool or indices)
- Returns:
- zlimits(NOBJ, M) array
Where
Mis the number ofpercentilesrequested.
- read_catalog(verbose=True)[source]
Read catalog specified in
params['CATALOG_FILE'].If the catalog is in a format other than FITS, the file format passed to
astropy.table.Table.readis indicated by theparams['CATALOG_FORMAT']parameter, which defaults toascii.commented_header.All catalogs must have an
idcolumn, either explicity or “translated” with theTranslateFile.While not required, additional columns
z_spec,ra,dec,x,yare used in some functions and should be included in the catalog or translated.
- static read_prior(zgrid=None, prior_file='templates/prior_F160W_TAO.dat', prior_floor=0.01, **kwargs)[source]
Read an eazy apparent magnitude prior file
- Parameters:
- zgridarray-like
Redshift grid
- prior_filestr
Filename
- prior_floorfloat
Forced minimum of (normalized) prior
- Returns:
- prior_magsarray, (M)
Apparent magnitudes of the prior grid for M mags
- prior_dataarray, (NZ, M)
Linear \(P(m, z)\)
# Show the prior

import os
import numpy as np
import matplotlib.pyplot as plt
from eazy import utils, photoz

zgrid = utils.log_zgrid((0.001, 7), 0.01)

path = utils.path_to_eazy_data()
prior_file = os.path.join(path, 'templates/prior_F160W_TAO.dat')

prior_mags, prior_data = photoz.PhotoZ.read_prior(zgrid=zgrid,
                            prior_file=prior_file,
                            prior_floor=1.e-2)

fig, ax = plt.subplots(1,1,figsize=(6,4))

for i, m in enumerate(prior_mags):
    if (m > 28.1) | (m - np.floor(m) > 0.1):
        continue

    ax.plot(np.log(1+zgrid), prior_data[:,i],
            label=f'm = {m:.1f}', color=plt.cm.rainbow((m-15)/13))

for m_i in np.arange(26.2, 26.9, 0.2):
    prior_m = photoz.PhotoZ._get_prior_mag(m_i, prior_mags,
                                       prior_data)
    ax.plot(np.log(1+zgrid), prior_m, color='k', linewidth=1,
        label=f'{m_i:.1f}', alpha=0.2)

xt = np.arange(0,7.1,1)
ax.set_xticks(np.log(1+xt))
ax.set_xticklabels(xt.astype(int))
ax.set_xlim(0, np.log(8))

ax.grid()
ax.legend(ncol=3, fontsize=8, title=os.path.basename(prior_file))
ax.set_xlabel('redshift')
ax.set_ylabel('Mag prior')
ax.semilogy()
fig.tight_layout(pad=0.1)
- read_zeropoint(zeropoint_file='zphot.zeropoint')[source]
Read zphot.zeropoint file with multiplicative flux corrections
The file has format
F205  1.1
F{FN} {scale}
where
FNis the filter number in the filter (and translate) file andscaleis multiplied to the fluxes and uncertainties of that filter.- Parameters:
- zeropoint_filestr
Filename
- residuals(selection=None, minsn=3, resid_sig_clip=5, update_zeropoints=False, update_templates=False, ref_filter=None, correct_zp=True, n_knots=-1, use_bspline=False, logspline=True, wlimits=[1000, 30000.0], runmed_kwargs={'NBIN': 16}, zpanel_kwargs={'catastrophic_limit': 0.15, 'zmax': 4, 'zmin': 0}, full_label=None, ignore_zeropoint=False, ignore_spline=False, run_iterative=True, skip_filters=[], iterative_nsteps=3, **kwargs)[source]
Show residuals and compute zeropoint offsets
selection=None update_zeropoints=False update_templates=False ref_filter=226 correct_zp=True NBIN=None
- rest_frame_SED(idx=None, norm_band=155, c='k', min_sn=3, median_args={'NBIN': 50, 'reverse': False, 'use_median': True, 'use_nmad': True}, get_templates=True, make_figure=True, scatter_args=None, show_uvj=True, axes=None, **kwargs)[source]
Make Rest-frame SED plot
idx: selection array
- rest_frame_fluxes(f_numbers=[153, 154, 155, 161], pad_width=0.5, max_err=0.5, ndraws=1000, percentiles=[2.5, 16, 50, 84, 97.5], simple=False, verbose=1, n_proc=-1, par_skip=10000, **kwargs)[source]
Rest-frame fluxes, refit by down-weighting bands far away from the desired RF band.
- Parameters:
- f_numberslist
List of either unit-indices of filters in
self.RESread fromparams['FILTER_FILE']orFilterDefinitionobjects.- pad_widthfloat
Padding around rest-frame wavelength to down-weight observed filters.
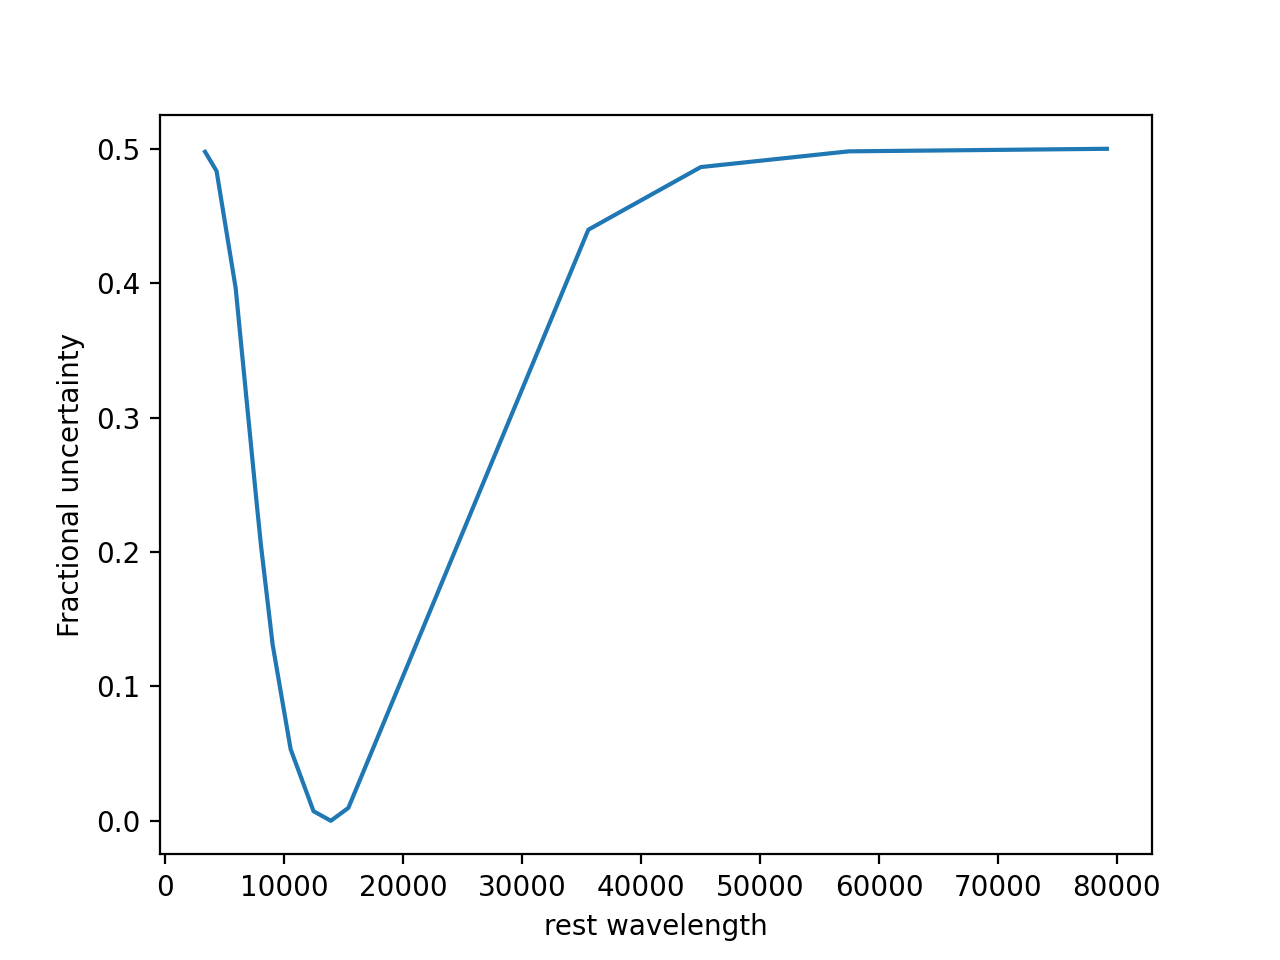
- max_errfloat
Increased uncertainty outside of
pad_width.The modified uncertainties are computed as follows:
import numpy as np
import matplotlib.pyplot as plt

pad_width = 0.5
max_err = 0.5
z = 1.5

# Observed-frame pivot wavelengths
lc_obs = np.array([10543.5, 12470.5, 13924.2, 15396.6,
                   7692.3,  8056.9,  9032.7, 4318.8,
                   5920.8, 3353.6, 35569.3, 45020.3,
                   57450.3, 79157.5])

lc_rest = 5500. # e.g., rest V
x = np.log(lc_rest/(lc_obs/(1+z)))
grow = np.exp(-x**2/2/np.log(1/(1+pad_width))**2)
TEFz = (2/(1+grow/grow.max())-1)*max_err
so = np.argsort(lc_obs)

_ = plt.plot(lc_obs[so], TEFz[so])
_ = plt.xlabel('rest wavelength')
_ = plt.ylabel('Fractional uncertainty')
(
Source code,png,hires.png,pdf)
- ndrawsint
Number of random draws for
simple=Falsefits, which does not have to be the same as that used forcoeffs_drawsattribute since the template coefficients are recalculated for every object. Ifsimple=True, then draws are fixed in the storedcoeffs_drawsattribute.- percentileslist
Percentiles to return of the computed rest-frame fluxes drawn from the fits including the observed uncertainties
- simplebool
If
Truethen just return the rest-frame fluxes of the currrent best fits rather than doing the filter reweighting.- fitterstr
Least-squares method for template fits. See
template_lsq.- renorm_tbool
Renormalize templates before fitting
- hess_thresholdfloat
Hessian threshold
- n_proc, par_skipint, int
Number of processes to use. If zero, then run in serial mode. Otherwise, will run in parallel threads splitting the catalog into
NOBJ/par_skippieces.
- Returns:
- rf_tempfiltarray (NZGRID, NTEMP, len(
f_numbers)) Array of the integrated template fluxes
- lc_restarray (len(
f_numbers)) Rest-frame filter pivot wavelengths
- rf_fluxesarray (NOBJ, len(
f_numbers), len(percentiles)) Rest-frame fluxes
- rf_tempfiltarray (NZGRID, NTEMP, len(
- save_templates(prefix='corr_', ext=None, format=None, overwrite=True, make_param=True)[source]
Write scaled versions of the templates to files, including a templates definition file
- set_ok_data()[source]
Determine valid catalog data:
Positive uncertainties
Finite flux densities and uncertainties (
numpy.isfinite)Flux densities greater than
NOT_OBS_THRESHOLDparameter
- Returns:
- nusefiltarray-like
Number of valid filters per object. Also sets the following attributes:
ok_data: boolean array with dimensions(NOBJ, NFILT)nusefilt: number of valid filterslc_reddest: Pivot wavelength of reddest valid filter
- set_prior(verbose=True)[source]
Read
param['PRIOR_FILE']Sets
prior_mags,prior_data,prior_mag_cat,full_logpriorattributes
- set_sys_err(positive=True, in_place=True)[source]
Include systematic error in uncertainties from
param['SYS_ERR'].- Parameters:
- positivebool
Only apply for positive fluxes in
fnuattribute.- in_placebool
Set
efnuattribute. Or if False, return array as below.
- Returns:
- efnuarray
Full uncertainty: \(\mathrm{efnu}^2 = \mathrm{efnu\_orig}^2 + (\mathrm{SYS\_ERR}*\mathrm{fnu})^2\)
- set_template_error(TEF=None, compute_tef_lnp=True)[source]
Set the Template Error Function
- Parameters:
- TEF
eazy.templates.TemplateErroror None If not specified, read from
params['TEMP_ERR_FILE']and scale byparams['TEMP_ERR_A2'].- compute_tef_lnpbool
Compute the likelihood normalization correction for the
TemplateErrorfunction.
- TEF
- Returns:
- Sets
TEF,TEFgridandcompute_tef_lnpattributes
- Sets
- set_zgrid()[source]
Set
zgridandtrdzattributes fromZ_MIN,Z_MAX,Z_STEP, andZ_STEP_TYPEparameters
- show_fit(id, id_is_idx=False, zshow=None, show_fnu=0, get_spec=False, xlim=[0.3, 9], show_components=False, show_redshift_draws=False, draws_cmap=None, ds9=None, ds9_sky=True, add_label=True, showpz=0.6, logpz=False, zr=None, axes=None, template_color='#1f77b4', figsize=[8, 4], ndraws=100, fitter=None, renorm_t=None, hess_threshold=None, show_missing=True, maglim=None, show_prior=False, show_stars=False, delta_chi2_stars=-20, max_stars=3, show_upperlimits=True, snr_thresh=2.0, with_tef=True, **kwargs)[source]
Make plot of SED and p(z) of a single object
- Parameters:
- idint
Object ID corresponding to columns in
self.OBJID. Or ifid_is_idxis set to True, then is zero-index of the desired object in the catalog array.- id_is_idxbool
See
id.- zshowNone, float
If a value is supplied, compute the best-fit SED at this redshift, rather than the value in the
self.zbestarray attribute.- show_fnubool, int
0: make plots in f-lambda units of 1e-19 erg/s/cm2/A.
1: plot f-nu units of uJy
2: plot “nu-Fnu” units of uJy/micron.
- get_specbool
If True, just return the SED data rather than make a plot
- xlimlist
Wavelength limits to plot, in microns.
- show_componentsbool
Show all of the individual SED components, along with their combination.
- show_redshift_drawsbool
Show templates at different redshifts drawn from the PDF
- draws_cmapcolor map
Color map for
show_reshift_draws=True, defaults tomatplotlib.pyplot.cm.rainbow.- showpzbool, float
Include p(z) panel. If a float, then scale the p(z) panel by a factor of
showpzrelative to half of the full plot width.- logpzbool
Logarithmic p(z) plot
- zrNone or [z0, z1]
Range of redshifts to show in p(z) panel. If None, then show the full range in
self.zgrid.- axesNone or list
If provided, draw the SED and p(z) panels into the provided axes. If just one axis is provided, then just plot the SED.
- template_colorcolor
Something
matplotlibrecognizes as a color- figsize(float, float)
Figure size
- ndrawsint
Number of random draws for template coefficient uncertainties
- fitterstr
Least-squares method for template fits. See
template_lsq.- renorm_tbool
Renormalize templates before fitting
- hess_thresholdfloat
Hessian threshold for removing degenerate templates
- show_missingbool
Show points for “missing” data
- maglim(float, float)
AB magnitude limits for second axis if
show_fnu=1.- show_priorbool
Show the apparent magnitude prior on the p(z) panel
- show_starsbool
Show stellar template fits given
delta_chi2_stars- delta_chi2_starsfloat
Show stellar templates where
star_chi2 - gal_chi2 < delta_chi2_starswheregal_chi2is the chi-squared value from the galaxy template fit at the plotted redshift.- max_starsint
Maximum number of stars to show that satisfy
delta_chi2_starsthreshold- show_upper_limitsbool
If False, the upper limit errorbar measurements will not be shown.
- snr_threshfloat
Sets the threshold in SNR required for a detection. This doesn’t affect anything related to the fits but non-detections are plotted in a lighter color.
- with_tefbool
Plot uncertainties including template error function at z.
- Returns:
- fig
matplotlib.figure.Figure Figure object
- datadict
Dictionary of fit data (photometry, best-fit template, etc.)
Key
Description
ix
catalog index
id
object id
z
redshift (see
zshow)z_spec
spectroscopic redshift
pivot
pivot wavelengths of filter bandpasses
model
best-fit template flux densities
emodel
uncertainties on model from fit covariance
fobs
observed photometry
efobs
observed uncertainties (sys_err but not TEF)
valid
fobs/efobs indicate valid data
tef
TEF evaluated at
ztemplz
observed-frame wavelength of full template spectrum
templf
flux density of best-fit template
show_fnu
show_fnuas passedflux_unit
units of flux density data
wave_unit
units of wavelength data
chi2
\(\chi^2\) of the best-fit template
coeffs
template coefficients
- fig
- show_fit_plotly(id_i, show_fnu=0, row_heights=[0.6, 0.4], zrange=None, template='plotly_white', showlegend=False, show=False, vertical=True, panel_ratio=[0.5, 0.5], subplots_kwargs={}, layout_kwargs={'showlegend': False, 'template': 'plotly_white'}, **kwargs)[source]
Plot SED + p(z) using
plotlyinterface
- spatial_statistics(band_indices=None, xycols=None, is_sky=True, nbin=(50, 50), bins=None, apply=False, min_sn=10, catalog_mask=None, statistic='median', zrange=[0.05, 4], verbose=True, vm=(0.92, 1.08), output_suffix='', save_results=True, make_plot=True, cmap='plasma', figsize=5, plot_format='png', close=True, scale_by_uncertainties=False)[source]
Show statistics as a function of position
- Parameters:
- band_indiceslist of int, None
Indices of the bands to process, in the order of the
self.pivot,self.filters, etc. lists. If None, do all of them.- statisticstr
- sps_parameters(UBVJ=[153, 154, 155, 161], extra_rf_filters=[270, 274, 120, 121, 156, 157, 158, 159, 160, 161, 162, 163], cosmology=None, simple=False, rf_pad_width=0.5, rf_max_err=0.5, percentile_limits=[2.5, 16, 50, 84, 97.5], template_fnu_units=<Quantity 1. solLum / Hz>, vnorm_type=2, n_proc=-1, coeffv_min=0, **kwargs)[source]
Rest-frame colors and population parameters at redshift in
self.zbestattribute- Parameters:
- UBVJ(int, int, int, int)
Filter indices of U, B, V, J filters in
params['FILTER_FILE'].- extra_rf_filterslist
If specified, additional filters to calculate rest-frame fluxes
- LIR_wave(min_wave, max_wave)
Limits in microns to integrate the far-IR SED to calculate LIR. (removed to always use tabulated in ``param.fits`` file)
- cosmology
astropy.cosmology Cosmology for calculating luminosity distances, etc. Defaults to flat cosmology with H0, OMEGA_M, OMEGA_L from the parameter file.
- simple, rf_pad_width, rf_max_errbool, float, float
See
rest_frame_fluxes.- template_fnu_units
astropy.units.Unit, None Units of templates when converted to
flux_fnu, e.g., \(L_\odot / Hz\) for FSPS templates. IfNone, then parameters are computed normalizing fits to the V band based onvnorm_type.- vnorm_type1 or 2
V-band normalization type for the tabulated parameters, if
template_fnu_units = None. The fit coefficients are first normalized to the template V-band, i.e., such that they give each template’s contribution to the observed rest-frame V-band. Then the population parameters are estimated with these coefficients as follows.vnorm_type = 1coeffs_norm: coefficients renormalized to template rest-frame V-bandtab: table of parameters associated with the templatesLv: V-band luminosity derived from the rest-frame V flux inferred from the photometry>>> Lv_norm = (coeffs_norm * tab['Lv']).sum() >>> mass_norm = (coeffs_norm * tab['mass']).sum() >>> mass = (mass_norm / Lv_norm) * Lv
vnorm_type = 2coeffs_norm: coefficients renormalized to template rest-frame V-bandtab: table of parameters associated with the templatesLv: V-band luminosity derived from the rest-frame V flux inferred from the photometry>>> mass_norm = (coeffs_norm * tab['mass'] / tab['Lv']).sum() >>> mass = (mass_norm / Lv_norm) * Lv
The latter,
vnorm_type = 2, is the conceptually preferred method, though the former should be used with the fsps_QSF_12_v3.param template set.- coeffv_minfloat
Mininum contribution to the observed v-band flux that contributes to the parameter estimates. Set to a small positive number to limit the contribution of extreme (dusty) M/Lv SFR/Lv templates to the derived parameters.
- n_procint
Number of parrallel processes
- Returns:
- tab:
astropy.table.Table Table with rest-frame fluxes and population synthesis parameters
- tab:
- standard_output(zbest=None, prior=False, beta_prior=False, UBVJ=[153, 154, 155, 161], extra_rf_filters=[270, 274, 120, 121, 156, 157, 158, 159, 160, 161, 162, 163], cosmology=None, simple=False, rf_pad_width=0.5, rf_max_err=0.5, save_fits=True, get_err=True, percentile_limits=[2.5, 16, 50, 84, 97.5], n_proc=0, clip_wavelength=1100, absmag_filters=[271, 272, 274], run_find_peaks=False, **kwargs)[source]
Full output to
zout.fitsfile.First refits the coefficients at
zmland optionallyzbest.Computes redshift statistics and then sends arguments to
sps_parametersfor rest-frame colors, masses, etc.- Parameters:
- zbestarray (NOBJ), None
If provided, derive properties at this specified redshift. Otherwise, defaults in internal
zmlmaximum-likelihood redshift.- priorbool
Include the apparent magnitude prior in
lnp.- beta_priorbool
Include the UV slope prior in
lnp(prior_beta).- UBVJlist of 4 ints
Filter indices of U, B, V, J filters in
params['FILTER_FILE'].- extra_rf_filterslist
If specified, additional filters to calculate rest-frame fluxes
- cosmology
astropy.cosmologyobject Cosmology for calculating luminosity distances, etc. Defaults to flat cosmology with H0, OM, OL from the parameter file.
- LIR_wave(min_wave, max_wave)
Limits in
micronsto integrate the far-IR SED to calculate LIR. removed to always use LIR in ``param.fits`` file- simple, rf_pad_width, rf_max_errbool, float, float
See
rest_frame_fluxes.- save_fitsbool / int
0: Return just the parameter table
1: Return the parameter table and data HDU and write ‘.data.fits’ file
2: Same as above, but also include template coeffs at all redshifts, which can be a very large array with dimensions (NOBJ, NZ, NFILT).
- get_errbool
Get parameter percentiles at
percentile_limits.- absmag_filterslist
Optional list of filters to compute absolute (AB) magnitudes
- Returns:
- tab
astropy.table.Table Table object. Output columns described here.
- hdu
astropy.io.fits.HDUListor None More fit data (coeffs, zgrid) needed for recreating fit state with
load_products. Seesave_fits.
- tab